Featured Products: PYXIS DCIM Lite

Central Monitoring & Management Software
Simplicity is key with our new PYXIS Data Centre Management software. All of the features that you need to make your life easier without the complications of traditional DCIM solutions.
PYXIS is a powerful monitoring application that enables Data Centre Managers to collect, record, display and analyse critical performance data from IT infrastructure and facilities equipment. PYXIS has been designed to offer many of the key benefits of a full-blown Data Centre Infrastructure Management (DCIM) solution but at a fraction of the cost.

Monitor
Monitor critical environments in multiple sites from a single screen/central location Monitor Jacarta monitoring devices, UPS Systems, BMS Systems, AC Units, Generators, Network Hardware, Generators and much more via SNMP and Modbus TCP Integrate ONVIF IP cameras into your monitoring solution

Alert
Alert relevant personnel to alarms using escalation procedures and powerful notification matrix. Choose the most effective alerting method for you – Email, SMS Text, Telephone Voice, Audio/Visual Alarm Beacon, SNMPset Commands, On-screen Alerts Immediately identify where problems have occurred using customised maps

Report
Analyse room and rack conditions as well as other activity within monitored locations, Appraise hardware, hardware reliability and calculate network uptime Identify environmental and power usage trends to improve network efficiency
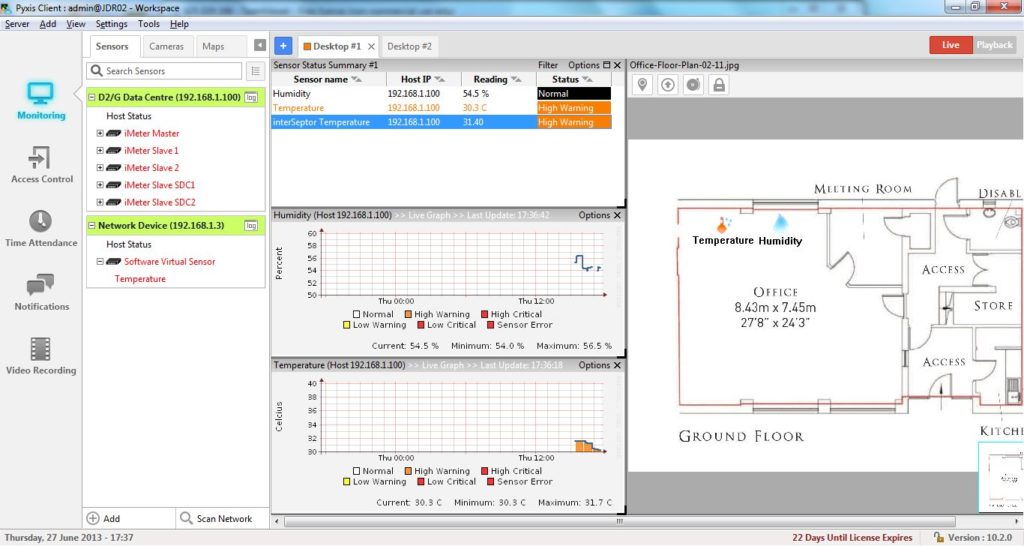
PYXIS’ flexible and intuitive Dashboard interface provides users with the ability to quickly and easily identify the status of connected equipment, thus providing the information needed to monitor and manage business-critical systems effectively.
The fully customisable ‘desktop’ can be configured to display preferred combinations of maps, graphs and IP camera feeds to give users the ability to see an overview of their network infrastructure from a single screen. Multiple ‘desktops’ can be created to focus on particular locations or areas of the infrastructure.
Dashboard

Map Views

Icons representing connected hardware can be easily created and positioned to provide an ‘image’ of infrastructure layout that is representative of your actual data centre or server room environment enabling you to quickly locate problems.
For example, icons highlighted red may represent a non-responsive switch or a PDU where the load has exceeded a user-defined threshold. A host of analysis tools are available within PYXIS to enable users to track key trends and to help identify where improvements in operational efficiency can be achieved.
By using these tools you can…
- Calculate PUE figures
- Identify environmental trends
- Calculate network uptime
- Analyse response time to potential problems
- Appraise hardware reliability
- Analyse room and rack activity within monitored locations
- PYXIS Alerting
PYXIS contains a powerful alert-management interface that enables notification routing to be tailored to all types of organisational requirements.
PYXIS can alert users to problems via:
- Local on-screen alerts
- Email (including sending images captured by connected IP Cameras)
- Alarm Beacon
- Automatic SNMPset commands
SMS text messages & automated telephone voice calls (using optional modem)
The alerting matrix allows customised alerts to be sent to key personnel only when required.
For example, if a UPS problem is experienced outside of office hours an alert can be sent directly to on-call staff. Users can also define custom escalation procedures helping to ensure that any threats to network infrastructure are dealt with before any serious problems are caused.